Thursday, March 28, 2013
Tuesday, March 26, 2013
Monday, March 25, 2013
Friday, March 22, 2013
Thursday, March 21, 2013
Wednesday, March 20, 2013
Nifty 20 Mar 2013 9:45 AM
30 mins chart
Nifty testing support but at the same time it looks bearish as inverted saucer which was made yesterday broke down today in the morning which acting as a bearish pattern. Caution for bears as it is now oversold market but political drama in the country along with Cyprus problem may act as a driver to this market.
Nifty testing support but at the same time it looks bearish as inverted saucer which was made yesterday broke down today in the morning which acting as a bearish pattern. Caution for bears as it is now oversold market but political drama in the country along with Cyprus problem may act as a driver to this market.
Monday, March 18, 2013
Thursday, March 14, 2013
Wednesday, March 13, 2013
Monday, March 11, 2013
Nifty 11 Mar 2013 8:42 AM
30 mins chart
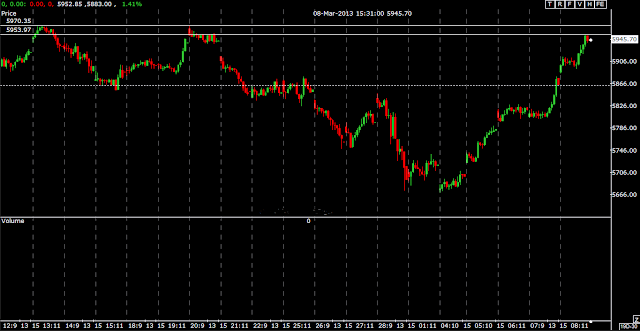
Nifty is going up breaking all its resistances with support from Dow (which is making newer highs). Nifty after rallying more than 250 points in the last week may halt near 5950.
Both 50 DMA at 4945 and Plateau which was made on 20 Feb 2013 ( http://niftystudycharts.blogspot.in/2013/02/nifty-22-feb-2013-854-pm.html ) may act as a resistance.
Friday, March 8, 2013
Thursday, March 7, 2013
Wednesday, March 6, 2013
Tuesday, March 5, 2013
Friday, March 1, 2013
Nifty 1 March 2013 8:44 AM
Nifty 30 mins chart
Nifty is still bearish and has a potential to go down further (caution : nifty is also oversold at these levels). As shown in the chart if unable to break and sustain above 5750 nifty may test the lower levels.
5750 is the level from where nifty bounced back on 27th Feb 13 forming V shaped recovery but could not cross the gap which which was created on 26 th Feb 13 ( near 5836) and fell heavily yesterday breaking 5750 (last hope for bulls) which triggered blood bath.
Subscribe to:
Comments (Atom)


